Lab 11: Build a Pedometer#
Last updated 8/13/24
00. Content #
Mathematics
3 dimensional vectors
Programming Skills
Working with Functions and Classes
0. Required Hardware #
Microcontroller: Raspberry Pi Pico
Breadboard
Micro-USB connector
LSM9DS0 sensor module
9-volt battery
LM7805 IC (voltage regulator IC)
Write your name and email below:
Name: me
Email: me @purdue.edu
1. Introduction #
A pedometer is a small electronic gadget that counts the number of steps taken by a person throughout the day. It is often worn on the waistline or fastened into clothing and detects motion and activity using a sensor. Pedometers are popular among health and fitness enthusiasts because they can provide a good measure of daily physical activity and help people track their progress toward fitness goals. Many current pedometers now include calorie counts, distance measurements, and heart rate monitors, making them much more useful for tracking general health and fitness.
Today we will work on building our own pedometer using a raspberry pi pico and some sensors.
But before we begin let us explore how to store and retrieve data in pico.
2. Storing Data in a Raspberry Pi Pico #
The Pico has 2MB of onboard memory or flash storage, so we can save some small files of sensor data directly on the Pico as a text or csv file. For applications which need more than 2MB of storage, we could always use connect an SD card module to our raspberry pi pico.
Let us look at an example program to see how to save data to the onboard flash memory in our pico.
Take a look at the file temperature.py, which records the Pico’s internal temperature in degrees Celcius and writes these temperature values to the file temp.txt. In this example, we are saving the temperature value at each instant on a new line in a text file.
Exercise 1#
Using Thonny, run temperature.py on your Pico.
After the script is done running, move the
temp.txtfile that is stored on the Pico into your computer.(In thonny - go to open-> pico-> save as onto the computer)
Delete
temp.txtfrom the Pico’s storage.Plot and visualize the temperature readings. Include appropriate x-axis and y-axis labels
Exercise 2#
Modify temperature.py to record the temperature values in degrees Fahrenheit.
After the script is done running, move the
temp.txtfile that is stored on the Pico into your computer.Delete
temp.txtfrom the Pico’s storage.Plot and visualize the temperature readings.Include appropriate x-axis and y-axis labels.
Attach the modified code along with your answers.
3. Building the Pedometer #
Gait is a person’s pattern of walking. Most wearable activity monitors like the FitBit or Apple Watch contain an internal accelerometer to track movement and estimate the user’s number of steps. In today’s lab, our goal is to build a pedometer in a similar way.
The LSM9DS0 sensor#
The LSM9DS0 is a system in a chip which packages three sensors, a 3-axis accelerometer, 3-axis gyroscope, and 3-axis magnetometer. Thats 9 sensor readings from a single chip! In addition to that it has both SPI and I2C serial interfaces for communication.
For building our pedometer we will be reading the accelerometer values along all 3 axes from the sensor using the I2C protocol.
I2C Communication Protocol#
Inter-Integrated Circuit or I2C is a serial communication protocol used to share data between multiple sensors and a micro-controller or between micro-controllers using the same bus. It requires only two wires for communication, a clock line (SCL) and a data line (SDA). I2C allows multiple devices to share the same communication bus. The devices are given a unique address which allows the devices in the network to be referred individually.
Raspberry Pi Pico has two I2C controllers which you can access through these GPIO pins:
I2C Controller |
GPIO Pins |
|---|---|
I2C0 – SDA |
GP0,GP4,GP8,GP12,GP16,GP20 |
I2C0 – SDA |
GP1,GP5,GP9,GP13,GP17,GP21 |
I2C1 – SCL |
GP2,GP6,GP10,GP14,GP18,GP26 |
I2C1 – SCL |
GP3,GP7,GP11,GP15,GP19,GP27 |
Wiring Up the Circuit#
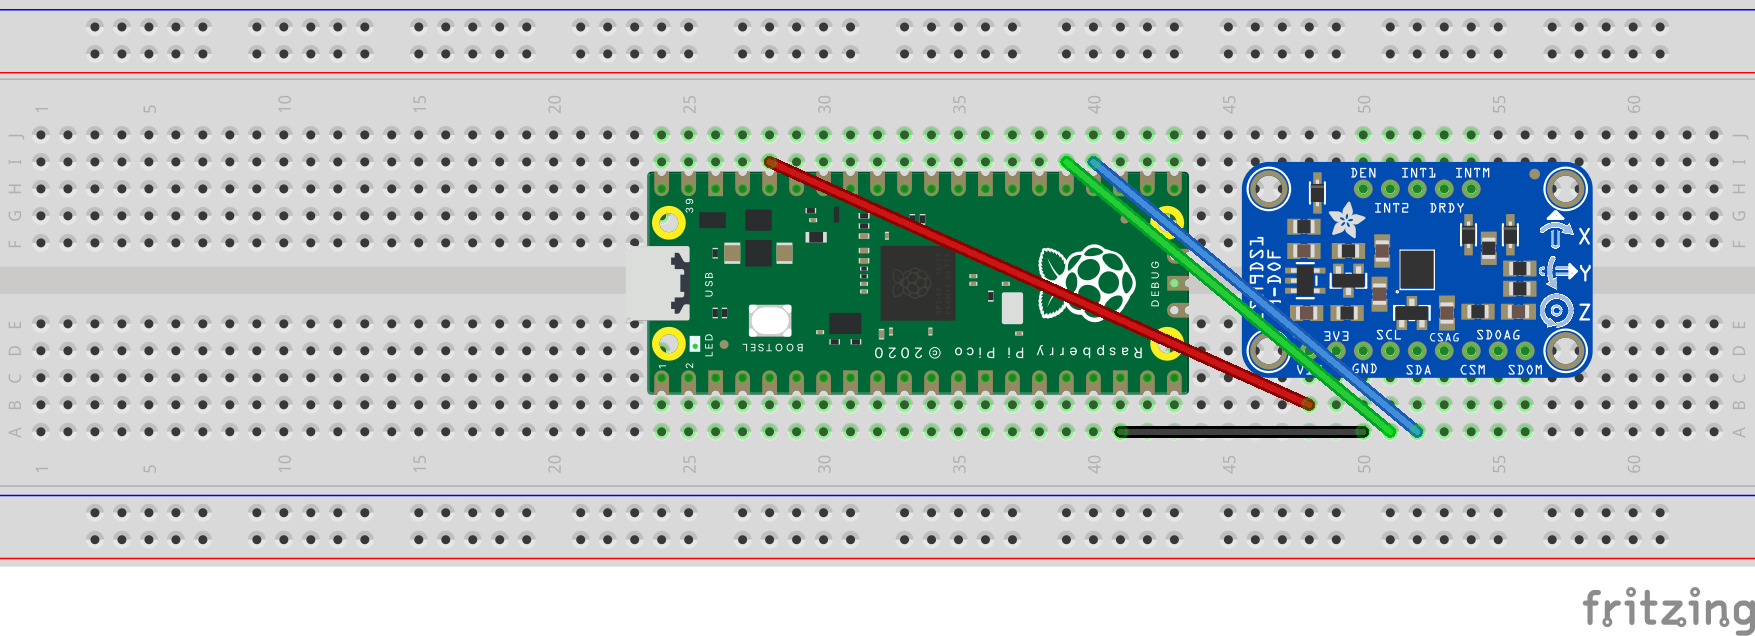
Wiring up the circuit for the pedometer is pretty simple. We will be using Pico pins GP18(Pin No. 24) and GP19(Pin No. 25) for our I2C communication.
LSM9DS0 Pin |
Raspberry Pico Pin |
|---|---|
SDA |
GP18 |
SCL |
GP19 |
GND |
GND |
VIN |
3V3 |
The circuit once completely wired will look something like this:

Accelerometer Driver#
Before testing the circuit, the lsm9ds0 driver needs to be put on the pico:
Dowload the lsm9ds0.py file from here
Open the file in thonny, save as onto the pico.
Run test_accelerometer.py on thonny with pico connected to your computer. If everything is connected properly you should start seeing the 3 components of acceleration from the accelerometer on the output.
Exercise 3#
For this exercise you will only need the accelerometer hooked up to the Pico connected to your laptop with the USB connector.
Modify test_accelerometer.py to store the \(x,y,\) and \(z\) components of acceleration to a .txt file named
teststeps.txtin the pico. Paste in modified code.Take 10 ‘fake’ steps while holding the breadboard close to your leg with everything else secured in your hand.
Plot the \(x,y,\) and \(z\) components of acceleration with detailed titles and axis labels.
Write Answers for Exercise 3 Below
In order to detect when a step has occured, we will look at the magnitude of the acceleration vector, \(G_a\) from \(\langle a_x,a_y,a_z \rangle\), where \(a_x,a_y,\) and \(a_z\) are the \(x,y\) and \(z\) components of acceleration respectively.
Exercise 4#
Using the data you collected in Exercise 3, plot the magnitute of the acceleration vector vs time. Make sure your graph has appropriate labels. Include your code with the answers.
Write Answers for Exercise 4 Below
Run it on batteries#
We will power the Pico from a 9-volt battery. Here are a few important cautions:
9 volts is more than any part of the Pico can handle. If you connect the battery directly you will damage the microcontroller. We need to use another component to convert the voltage to a range which the Pico can handle.
It is not safe to power the Pico from more than one source at a time. That means you must not connect the Pico to a computer while it is powered by a battery, and you must not connect a battery while it is connected to a computer.
main.py#
Before running your pico from a battery, here is a question: how will we start the program without using Thonny? The pico needs to run without being connected to a computer.
Here is the trick we will use: when the Pico powers on, the first thing it does is check its memory for a file called main.py. If there is a file with that name, it runs the file. So there is our solution: make a file called main.py which starts the accelerometer program. Or just rename the file we already have. The important thing is that the file is called main.py, and it’s actually stored on the pico.
Before continuing make sure you have your code starting whenever it gets connected to power. You should be able to plug the the microcontroller into any USB port and watch it start up automatically without doing anything on the computer. Once you have this, you can move on to powering it by battery.
The 7805 voltage regulator#
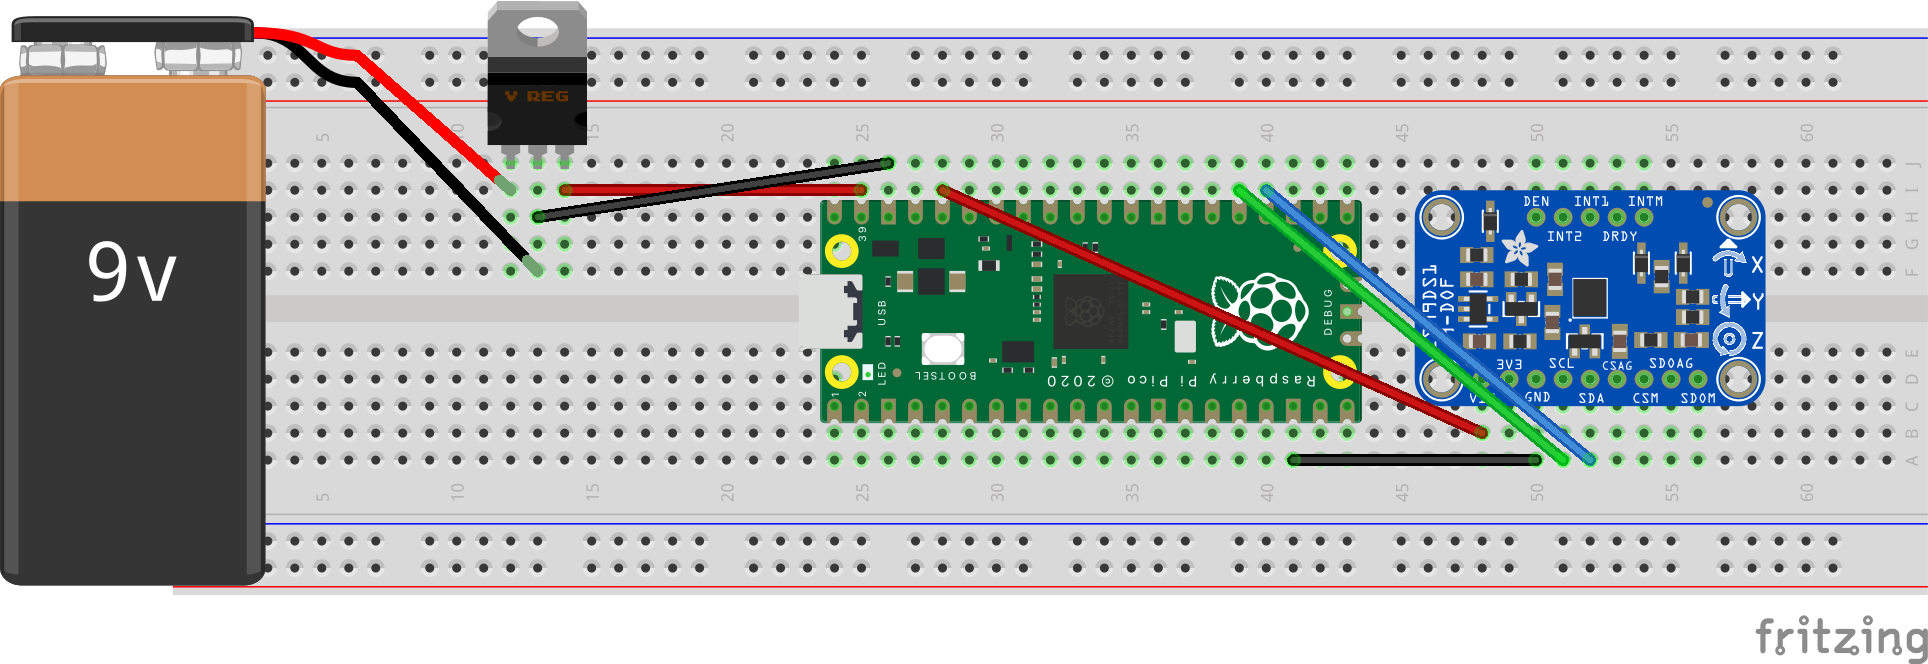
Since 9V is more than what the Pico can handle, we will be using a 7805 voltage regulator IC to step down the voltage to around 5V. The pinout for wiring the circuit is given below.
Battery |
7805 IC |
|---|---|
black |
GND |
RED |
INPUT |
Raspberry Pi Pico |
7805 IC |
|---|---|
VSYS |
OUTPUT |
GND |
GND |
The pins on the 7805 are not labeled. You will have to check the data sheet. Do not connect the battery until you have had your circuit checked by an instructor. The correctly wired voltage regulator should look as shown in the image below.

You might have observed that the plot is erratic and noisy at times. This may be due to multiple factors like small vibrations due to the sensor not being fixed to a board, small movements of the hand while holding the breadboard close to the leg etc.
Let us average the sensor readings over 50 samples to get a less noisy data. The class Averager allows us to reduce error by averaging across multiple acceleration measurements.
To use this class in accelerometer_averaged in Exercise 5, first put averager_solution.py on the pico:
Dowload the averager_solution.py file from here
Open the file in thonny, save as onto the pico.
Exercise 5#
Run accelerometer_averaged.py using the main method on Pico.
Take 10 ‘fake’ steps while holding the battery powered breadboard circuit close to your leg with everything else secured in your hand.
Using the data you collected in
test_accel.txt, plot the magnitute of the acceleration vector, \(G_a\) vs time. Make sure your graph has appropriate labels.How does the length of the averager affect the graph of the magnitude of the acceleration vectors?
Write Answers for Exercise 5 Below
The plot shows that the graph is not centered around 0. Subtracting mean of \(G_a\) from \(G_a\) will remove constants like gravity from the sensor data.
Exercise 6#
Compute and plot the magnitute of the acceleration vector, \(G_a\).
Calculate mean of \(G_a\): \(\hat{G_a}\).
Subtract \(\hat{G_a}\) from \(G_a\).
Plot \(G_a\) - \(\hat{G_a}\). Make sure your graph has appropriate labels.
Write Answers for Exercise 6 Below
The plotted data is now centered about zero, and clearly shows peaks in acceleration magnitude. Each peak corresponds to a step being taken while walking. Count the number of peaks to get the approximate number of steps. It is good to count the number of peaks greater than a minimum threshold to get a better result.
Exercise 7#
Calculate the number of steps from the accelerometer readings. Include the code along with your submission.
Write Answers for Exercise 7 Below
Reflection #
1. What parts of the lab, if any, do you feel you did well?
2. What are some things you learned today?
3. Are there any topics that could use more clarification?
4. Do you have any suggestions on parts of the lab to improve?
