Laboratory 4b: Build an Inclinometer (Objects on Hardware)#
Weeks 6-7
Last updated April 22, 2025
00. Content #
Mathematics
Removing noise by averaging
Programming Skills
Averaging function
Program components to work together as an inclinometer
Embedded Systems
Button input
Use a screen to display values
Display a clock
Use an accelerometer
Running a Pi on battery power
Use a voltage regulator
Thonny and Micropython
0. Required Hardware #
Microcontroller: Raspberry Pi Pico
Button
OLED (clock)
MPU-6050 (accelerometer)
7805 voltage regulator
9-volt battery
Wires
Breadboard
USB connector
Copy the file `student_info.py` into the folder you are working in, then run this cell to put your name and email into this document
from student_info import show_info

show_info()
Additional lab materials#
In addition to the student_info.py file, you’ll need a couple more specific Python files to complete this lab.
Run the following cell. This will download a folder called lab4B/ into your Downloads folder. After you have done that, pull up thonny, and on the top bar under ‘View’, select ‘Files’. This will bring up a bar on the side that you can use to transfer the file onto your Pico. In this side bar, navigate to your Downloads folder (If you get lost, you can find it at This Computer/home/shay/a/"your username"/Downloads), right click the lab4B/ folder, then click on ‘Upload to /’. This will copy the entire folder onto your Pico.
%%sh
cd ~/Downloads
if [ -d "./lab4B/" ]; then
    rm -r "./lab4B"
fi
mkdir lab4B
cd lab4B
wget -q -N https://raw.githubusercontent.com/TheDataScienceLabs/DSLab_Calculus/main/book/labs/4_measure_tall_things/b_build_an_inclinometer/scripts/ssd1306.py
wget -q -N https://raw.githubusercontent.com/TheDataScienceLabs/DSLab_Calculus/main/book/labs/4_measure_tall_things/b_build_an_inclinometer/scripts/procedural_clock.py
wget -q -N https://raw.githubusercontent.com/TheDataScienceLabs/DSLab_Calculus/main/book/labs/4_measure_tall_things/b_build_an_inclinometer/scripts/classy_clock.py
wget -q -N https://raw.githubusercontent.com/TheDataScienceLabs/DSLab_Calculus/main/book/labs/4_measure_tall_things/b_build_an_inclinometer/scripts/button.py
wget -q -N https://raw.githubusercontent.com/TheDataScienceLabs/DSLab_Calculus/main/book/labs/4_measure_tall_things/b_build_an_inclinometer/scripts/imu.py
wget -q -N https://raw.githubusercontent.com/TheDataScienceLabs/DSLab_Calculus/main/book/labs/4_measure_tall_things/b_build_an_inclinometer/scripts/vector3d.py
wget -q -N https://raw.githubusercontent.com/TheDataScienceLabs/DSLab_Calculus/main/book/labs/4_measure_tall_things/b_build_an_inclinometer/scripts/accelerometer.py
cd ..
Next, run the following block to download the averager.py module into your current directory, which we will use later.
%%sh
wget -q -N https://raw.githubusercontent.com/TheDataScienceLabs/DSLab_Calculus/main/book/labs/4_measure_tall_things/b_build_an_inclinometer/averager.py
1. Objective #
An inclinometer is a device for measuring the angle between a sight line and the horizon. For lab 4c, you will need an inclinometer which you can use outdoors, not connected to a computer. Here are some requirements:
it should run on battery power alone
it should have a display which you can read, telling you the components of acceleration
it should have a “hold” button, which freezes the display while pressed so that a reading can be made
The cheapest inclinometer on Amazon which meets these requirements costs about 30 dollars. Can we do better? If we spend 4 dollars on a Raspberry Pi Pico, 4 dollars on an OLED display, 3 dollars on an accelerometer chip and 3 dollars on a 9 volt battery with a holder, that leaves us 16 dollars to buy wires and a case. Not bad! Plus, ours will be more customizable – we could easily add features down the road, if we want them.
3. The Screen #
I2C#
Usually a modern electronic device will consist of a microcontroller (such as the Raspberry Pi Pico) and several peripherals. “Peripherals are what we call any component the microcontroller is “in charge” of. The two main peripherals we will be using in our inclinometer are a screen and an accelerometer. You might call the button a peripheral, but usually the word peripheral refers to components which do something on their own, while communicating with the microcontroller.
One of the most popular ways for a microcontroller to communicate with a peripheral is using a protocol called the Inter-Integrated-Circuit protocol. Its name is usually abbreviated, either as IIC, I²C, or simply I2C. These are pronounced as “eye-eye-see”, “eye-squared-see” or “eye-two-see” respectively. I2C uses two wires, one called Serial Clock (abbreviated as SCL) and the other called Serial Data (abbreviated SDA). One of the brilliant things about I2C is that every I2C peripheral has its own identification number, so when a message is sent using the I2C protocol it can have a label saying “who it is for”. That means you can have several different peripherals all connected to the same two wires – potentially connecting dozens of peripherals to a microcontroller using only two wires (assuming none of the devices share an identification number). Since many devices are sharing the same connection an I2C connection is called a “bus”, from the Latin Omnibus which means “for everyone”. I2C is an example of a serial communication protocol, because bits of data are sent one after another (in a series) over relatively few wires, instead of all-at-once over relatively many wires. You have already heard of, and used, another serial bus protocol – the so-called Universal Serial Bus, usually abbreviated as USB.
The Raspberry Pi Pico has two I2C busses, numbered 0 and 1. You can see which pins they are connected to on the Pico’s datasheet; for example, to use I2C bus number 0, you can use any of the GP pins labeled as I2C0 SCL and I2C0 SDA. For example, GP pins (20 & 21), or (12 & 13), or (4 & 5).
When you set up an I2C bus, you will have to choose a frequency for it to use. This is a fairly straightforward decision. The valid choices of frequency are 100,000; 400,000; 1,000,000; 1,700,000; and 3,400,000 Hertz. If you use a higher frequency then your system will run faster and consume more power. Higher frequencies might not work, depending on several factors such as how long your wires are and how much electromagnetic interference they experience. However, not all peripherals will continue to function properly if the frequency is too high, so because speed is not necessarily important to us, we will stick with 400,000 hertz.
The framebuffer#
On the hardware side, we interact with the OLED display using I2C. In software, the interface we will use is one of the interfaces built into Micropython: the frame buffer interface.
It’s called a frame buffer because when interacting with it, you make most of your changes in an array called a buffer, stored on the Pico. We only send data to the display when we call the function show(), as a complete frame ready to display. This way, we are using the I2C bus as little as possible, freeing up time for other peripherals to use the I2C bus.
The documentation for the frame buffer interface is part of the Micropython documentation. There you will find functions for drawing lines, rectangles, and text, as well as a function for writing to individual pixels. It is important to note that pixels on the screen are referenced based on their horizontal and vertical distance from the top left corner.
Two clocks#
Usually the easiest way to learn a new tool is to see it used. As an example, we have provided two programs (which you have installed earlier) that do the same thing using the OLED display. procedural_clock.py draws a clock on the display by performing a sequence of actions one after another, inside a while True loop. classy_clock.py does the exact same steps, but wraps everything to do with the display into one class and defines methods on the class to do the various parts. Note that in practice you would usually define any classes you are using in a separate module, and import those classes into your main file. We have chosen to put the class definition at the bottom of the file to make it easier for you to compare them.
In terms of what they do, both of these programs are identical. Their difference lies in how easy they are to read and how easy they are to modify.
Exercise 2 (20 pts)#
Read the programs procedural_clock.py and classy_clock.py carefully. Reflect on the way the code is organized in each in two thorough paragraphs.
What are their relative merits? What might make one or another of these programs easier to read, modify or extend? Which ones would be easiest to split apart into multiple smaller modules? Which ones are more aesthetically pleasing? Give your honest assessment, since many of these questions are matters of opinion. Be sure to refer to specific lines from the programs in your answer.
Write Answers for Exercise 2 Below
Display a clock#
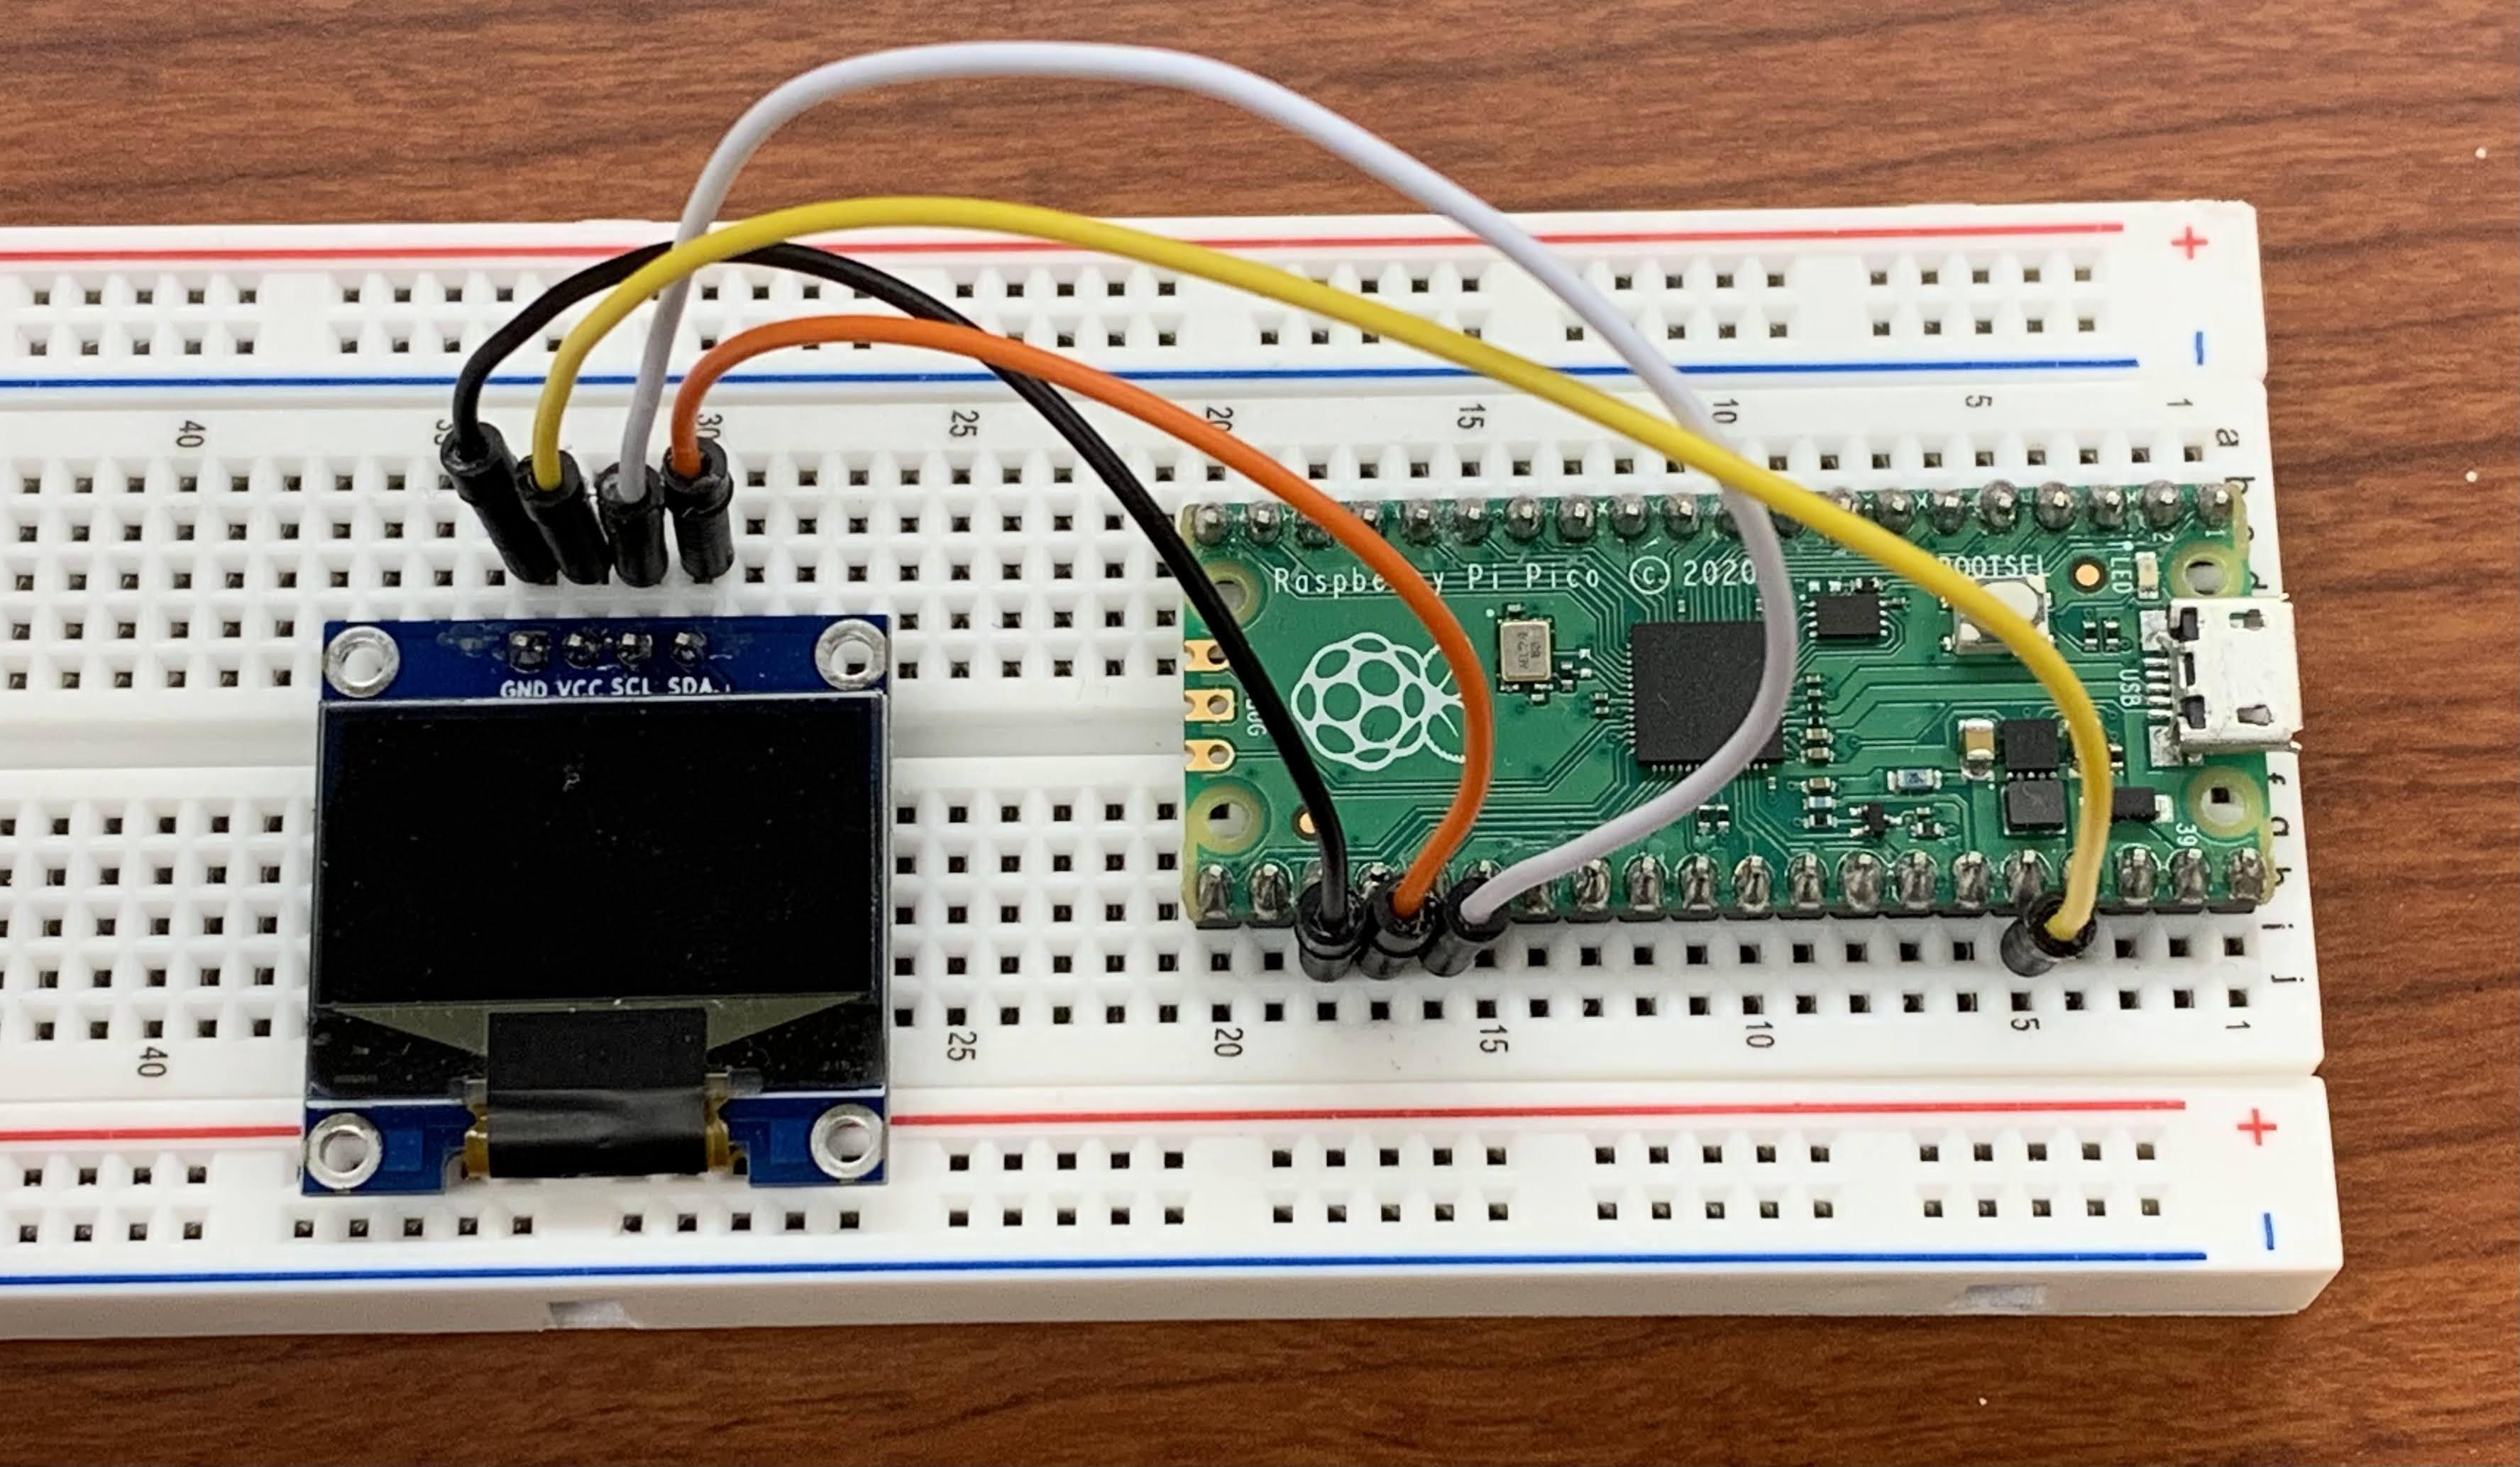
The wiring is very simple for this one. There are only four wires to use: power, ground, and the two I2C wires. Unplug your microcontroller from the computer and wire up the display.
OLED |
Pico |
|---|---|
GND |
GND |
VCC |
3V3(OUT) |
SCL |
I2C0 SCL or I2C1 SCL |
SDA |
I2C0 SDA or I2C1 SDA |
If you are uncertain about your wiring, then ask for an instructor to check it over. If you are confident in your wiring you can continue. It should look as shown in the image below.
Exercise 3 (5 pts)#
You should have uploaded the file ssd1306.py onto your Pico using Thonny earlier. This provides a class for interacting with the specific OLED displays we are using. Then, pick your favorite of the clock programs and run it. If you choose to use different I2C pins than the examply above you may need to modify the line which sets up the I2C bus according to the specific SCL and SDA pins you choose (using the number labeled with GP on the datasheet, not the SCL or SDA numbers) as well as the id to 0 for I2C0 or 1 for I2C1. Once you have one of the clocks up and running, just write a note below indicating that you have done so.
Write Answers for Exercise 3 Below
4. The Accelerometer #
In recent years so-called Micro Electro Mechanical Systems (MEMS) have become very cheap and reliable. These are made using processes which are similar to the ones used to make computer chips. One common type is an accelerometer, which does pretty much what it says: measures acceleration.
Why does this help us to make an inclinometer? An inclinometer is usually held very still to make a measurement; it’s not accelerating. Naively, we might think an accelerometer would tell us nothing about a stationary object, except that it is stationary. As it turns out, that naive view is incorrect because of general relativity. As it turns out, the effect of gravity also shows up in our measurements as an acceleration. If you wish to learn more about this, you can see this short video which has helpful animations, or this more impassioned video from a professional physicist who presents the limits of this interpretation of gravity. For our purpose, it is enough to know that if the accelerometer is being held still, it will indicate the direction of gravity. By angling our accelerometer toward a target, we can find the angle between the target and vertical.
Raw readings#
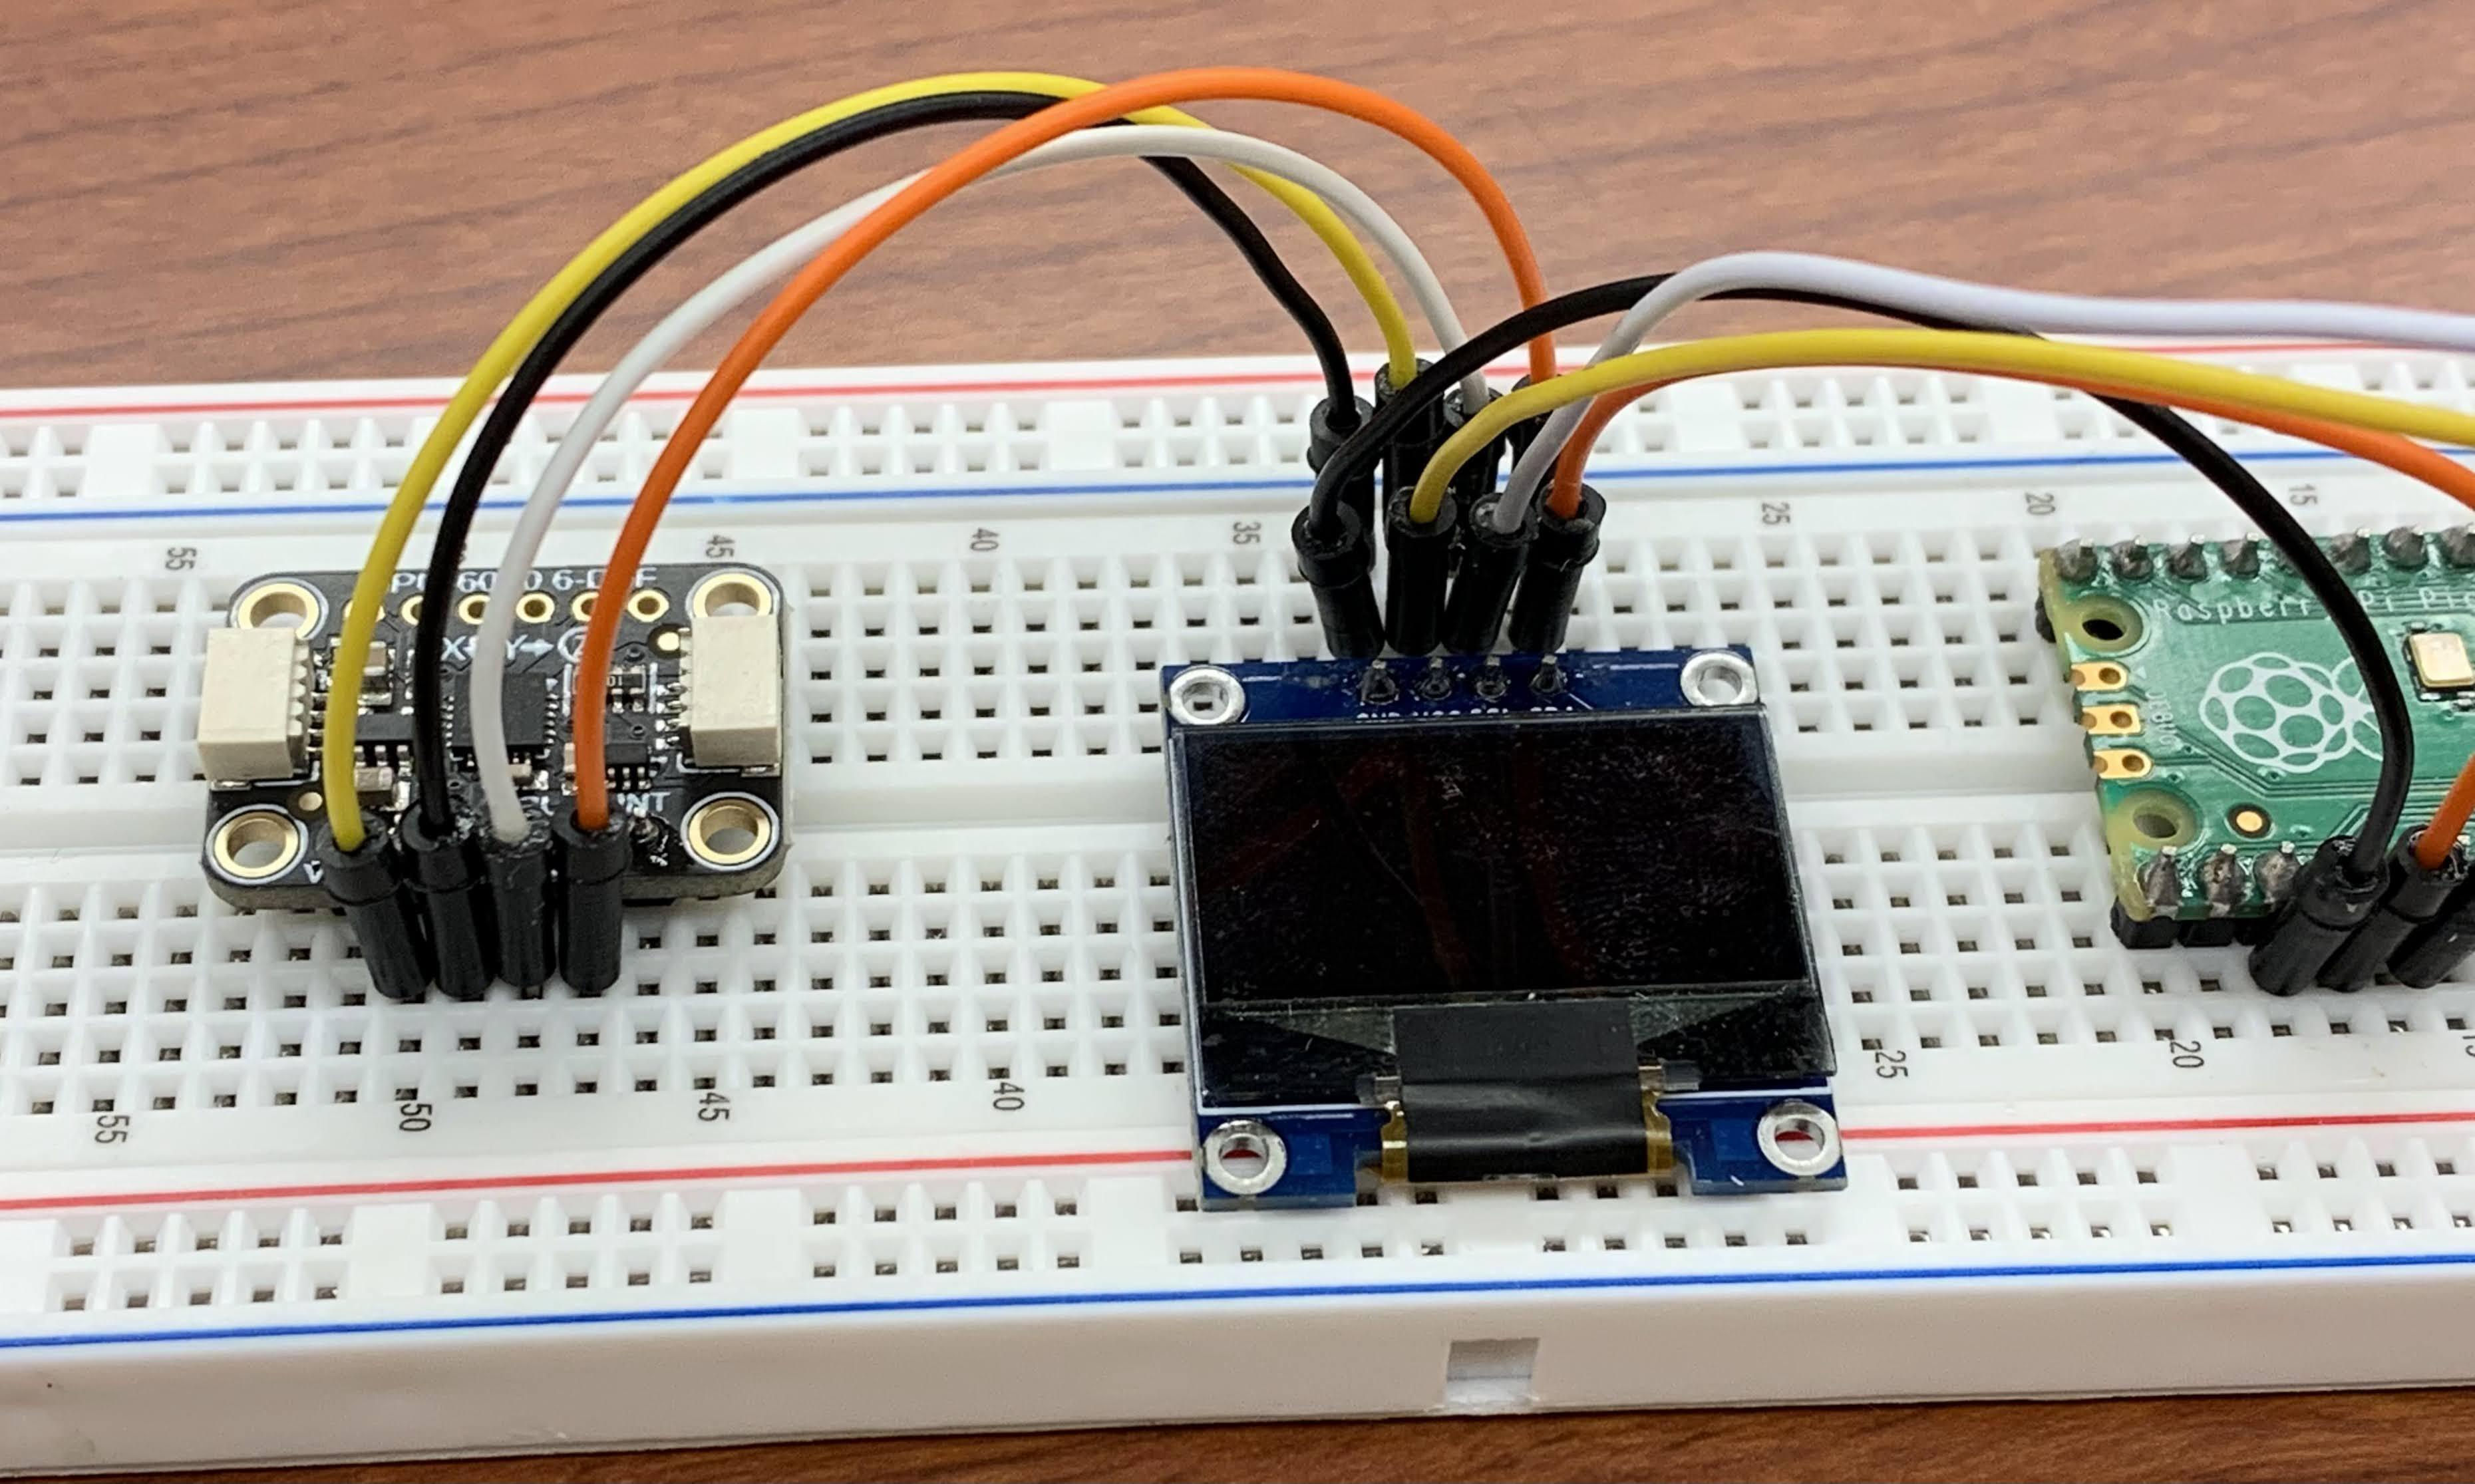
We will use an accelerometer called the MPU-6050. It also uses I2C, so we can use the same bus to communicate with it. Go ahead and connect it.
MPU-6050 |
OLED |
|---|---|
GND |
GND |
3Vo |
VCC |
SCL |
SCL |
SDA |
SDA |
It should look as shown in the image below.
Verify that imu.py and vector3d.py are loaded onto the Pico, and then run the file accelerometer.py in Thonny. Again you may need to modify accelerometer.py so that the line where the I2C bus is configured uses the right pins. You should see it printing values in Thonny.
Exercise 4 (10 pts)#
Describe the values in words, including a description of what happens when you move the accelerometer around while the program is running. About how many of the digits appear stable, that is, not fluctuating unpredictably?
Write Answers for Exercise 4 Below
Reducing error through averaging#
One way we are familiar with reducing error is by taking multiple measurements and averaging them. We could do that ourselves, but why not have the microcontroller do it for us? Since we will be reading off values by eye, this could dramatically reduce the amount of numbers we have to write down. In order to make this easy, let’s build a class to do it for us. Since we are using Micropython, we can run and test our module here and have confidence that it will work the same way on our microcontroller.
Warm Up to Exercise 5 (0 pts)#
Read and understand the following code:
Part 1: In one line of code, change the first element of the list mylist to the value \(11.0\).
mylist = [1.0, 22.0, 33.0]
print(mylist)  # prints [1.0, 22.0, 33.0]
mylist[0] = 11.0
print(mylist)  # should print [11.0, 22.0, 33.0]
Part 2: Write a function called add_element() with three inputs: list, value, and i. The function changes the element at index i of the given list to value and returns the modified list.
def add_element(list, value, i):
    list[i] = value
    return list

print(add_element(mylist, 2.0, 1))  # changes mylist to [11.0, 2.0, 33.0]
Exercise 5 (15 pts)#
Most of this class is written already – it’s just missing two methods. You can find it in averager.py. Your task is to fill in the two missing methods, append() and get(), so that the class will pass all its tests. You can take a look at the docstrings of the functions and the examples provided above to get an idea of what they need to be doing. Go ahead and remove the lines of code that says raise NotImplementedError(“This is an exercise for the student”) when you are ready to test them.
We have provided tests in the form of examples written in the class’s docstring. Don’t worry, you don’t have to check them yourself. There is a convenient tool built into Python which will check the examples in the documentation for us. Run the first two cells below to check your progress. Then, run the third cell which will display the contents of your completed module for grading.
Write Answers for Exercise 5 Below
%load_ext autoreload
%autoreload 2
import doctest

import averager

doctest.testmod(averager)
import inspect

print(inspect.getsource(averager))
Exercise 6 (10 pts)#
Upload averager.py onto the Pico using Thonny, and change accelerometer.py so that the components of acceleration are averaged out using the Averager class. Play with the size of the averager, in particular paying attention to how long it takes the values to adjust to a change in position. Then answer these questions:
What are the benefits of keeping fewer previous values? What are the benefits of keeping more?
How many is too many? At what point does it become no longer practical to store more values?
Is there a point of diminishing returns, where you could keep more values stored but it wouldn’t help much?
Write Answers for Exercise 6 Below
5. Make an Inclinometer #
Exercise 7 (30 pts)#
Now you are ready to combine all the components into a useful tool. You must make an inclinometer, with the following features:
display the x, y, and z components of acceleration
averaged across a reasonable number of measurements
reported with a reasonable number of digits
with a label indicating which is which
have a “hold” button which keeps the display from changing while it is pressed
There are several additional features you can include if you like (but are not required):
turn on the onboard LED when the z-component is very close to zero, so that you can tell at a distance if it is being held vertically
instead, turn on the onboard LED when the values stored in the averager are very close together (to indicate when you are holding the accelerometer still). This may require modifying
averager.py, adding another method to check how much the values vary.don’t update the display every time you read a new value, instead pick a reasonable number of measurements to take in between screen updates. This will let you increase the number of samples in your averager without increasing the time it takes to get a reading.
display the measured angle of elevation, in radians and/or degrees
put some decorative art on the screen
make the hold button a toggle, and show an indicator on the screen if the inclinometer is in hold mode.
any other features you may think of
In addition you must include a description of your inclinometer, explaining how you chose to organize your code and why – what parts did you put into modules? What parts made sense to include as object methods, what parts as functions? How did you choose how many samples to average, and how many digits to show? Your description should also explain what the features of your inclinometer are, and how to use it.
You will be graded on the following rubric:
Category |
10 pts |
5 pts |
0 pts |
|---|---|---|---|
Functionality |
Has all the required features, as well as at least one additional feature |
Missing one required feature, or one of the features does not work as it should |
Missing more than one required feature |
Style |
Uses classes, functions, and modules where appropriate. Uses consistent spacing and style, with comments and docstrings where appropriate. |
Some unconventional choices were made which make the code hard to read, but there were clearly deliberate design choices made to make the code easier to understand. |
There are several places where functions, classes, or modules would have improved the readability but they were not used. |
Documentation |
The description supports the choices made in the code. Based on the description it is clear how to use the inclinometer, and what features it has. The structure of the program is described in full sentences. |
One or more major choice about the code was not supported, or at least one feature is not documented, or there are multiple grammatical or spelling errors. |
The description does not do a good job of describing the code and does not justify the choices which were made. |
You should type your description below, and paste the content of each file you write into this document so that it can be graded. If you choose to include a module which was already graded as part of this lab, you don’t need to paste it here.
Write Answers for Exercise 7 Below
Write your description here
# Paste your code here
Run it on batteries#
At the start of class next week, we will go outside to take some measurements using your accelerometer. We will power the Pico from a 9-volt battery. Here are a few important cautions:
9 volts is more than any part of the Pico can handle. If you connect the battery directly you will damage the microcontroller. We need to use another component to convert the voltage to a range the Pico can handle.
It is not safe to power the Pico from more than one source at a time. That means you must not connect the Pico to a computer while it is powered by a battery, and you must not connect a battery while it is connected to a computer.
main.py#
Before running your inclinometer from a battery, here is a question: how will we start the program without using Thonny? The inclinometer needs to run without being connected to a computer.
Here is the trick we will use: when the Pico powers on, the first thing it does is check its memory for a file called main.py. If there is a file with that name, it runs the file. So there is our solution: make a file called main.py which starts the inclinometer. Or just rename the file we already have. The important thing is that the file is called main.py, and it’s actually stored on the microcontroller.
Before continuing make sure you have your inclinometer starting whenever it gets connected to power. You should be able to plug the the microcontroller into any USB port and watch it start up automatically without doing anything on the computer. Once you have this, you can move on to powering it by battery.
The 7805 voltage regulator#
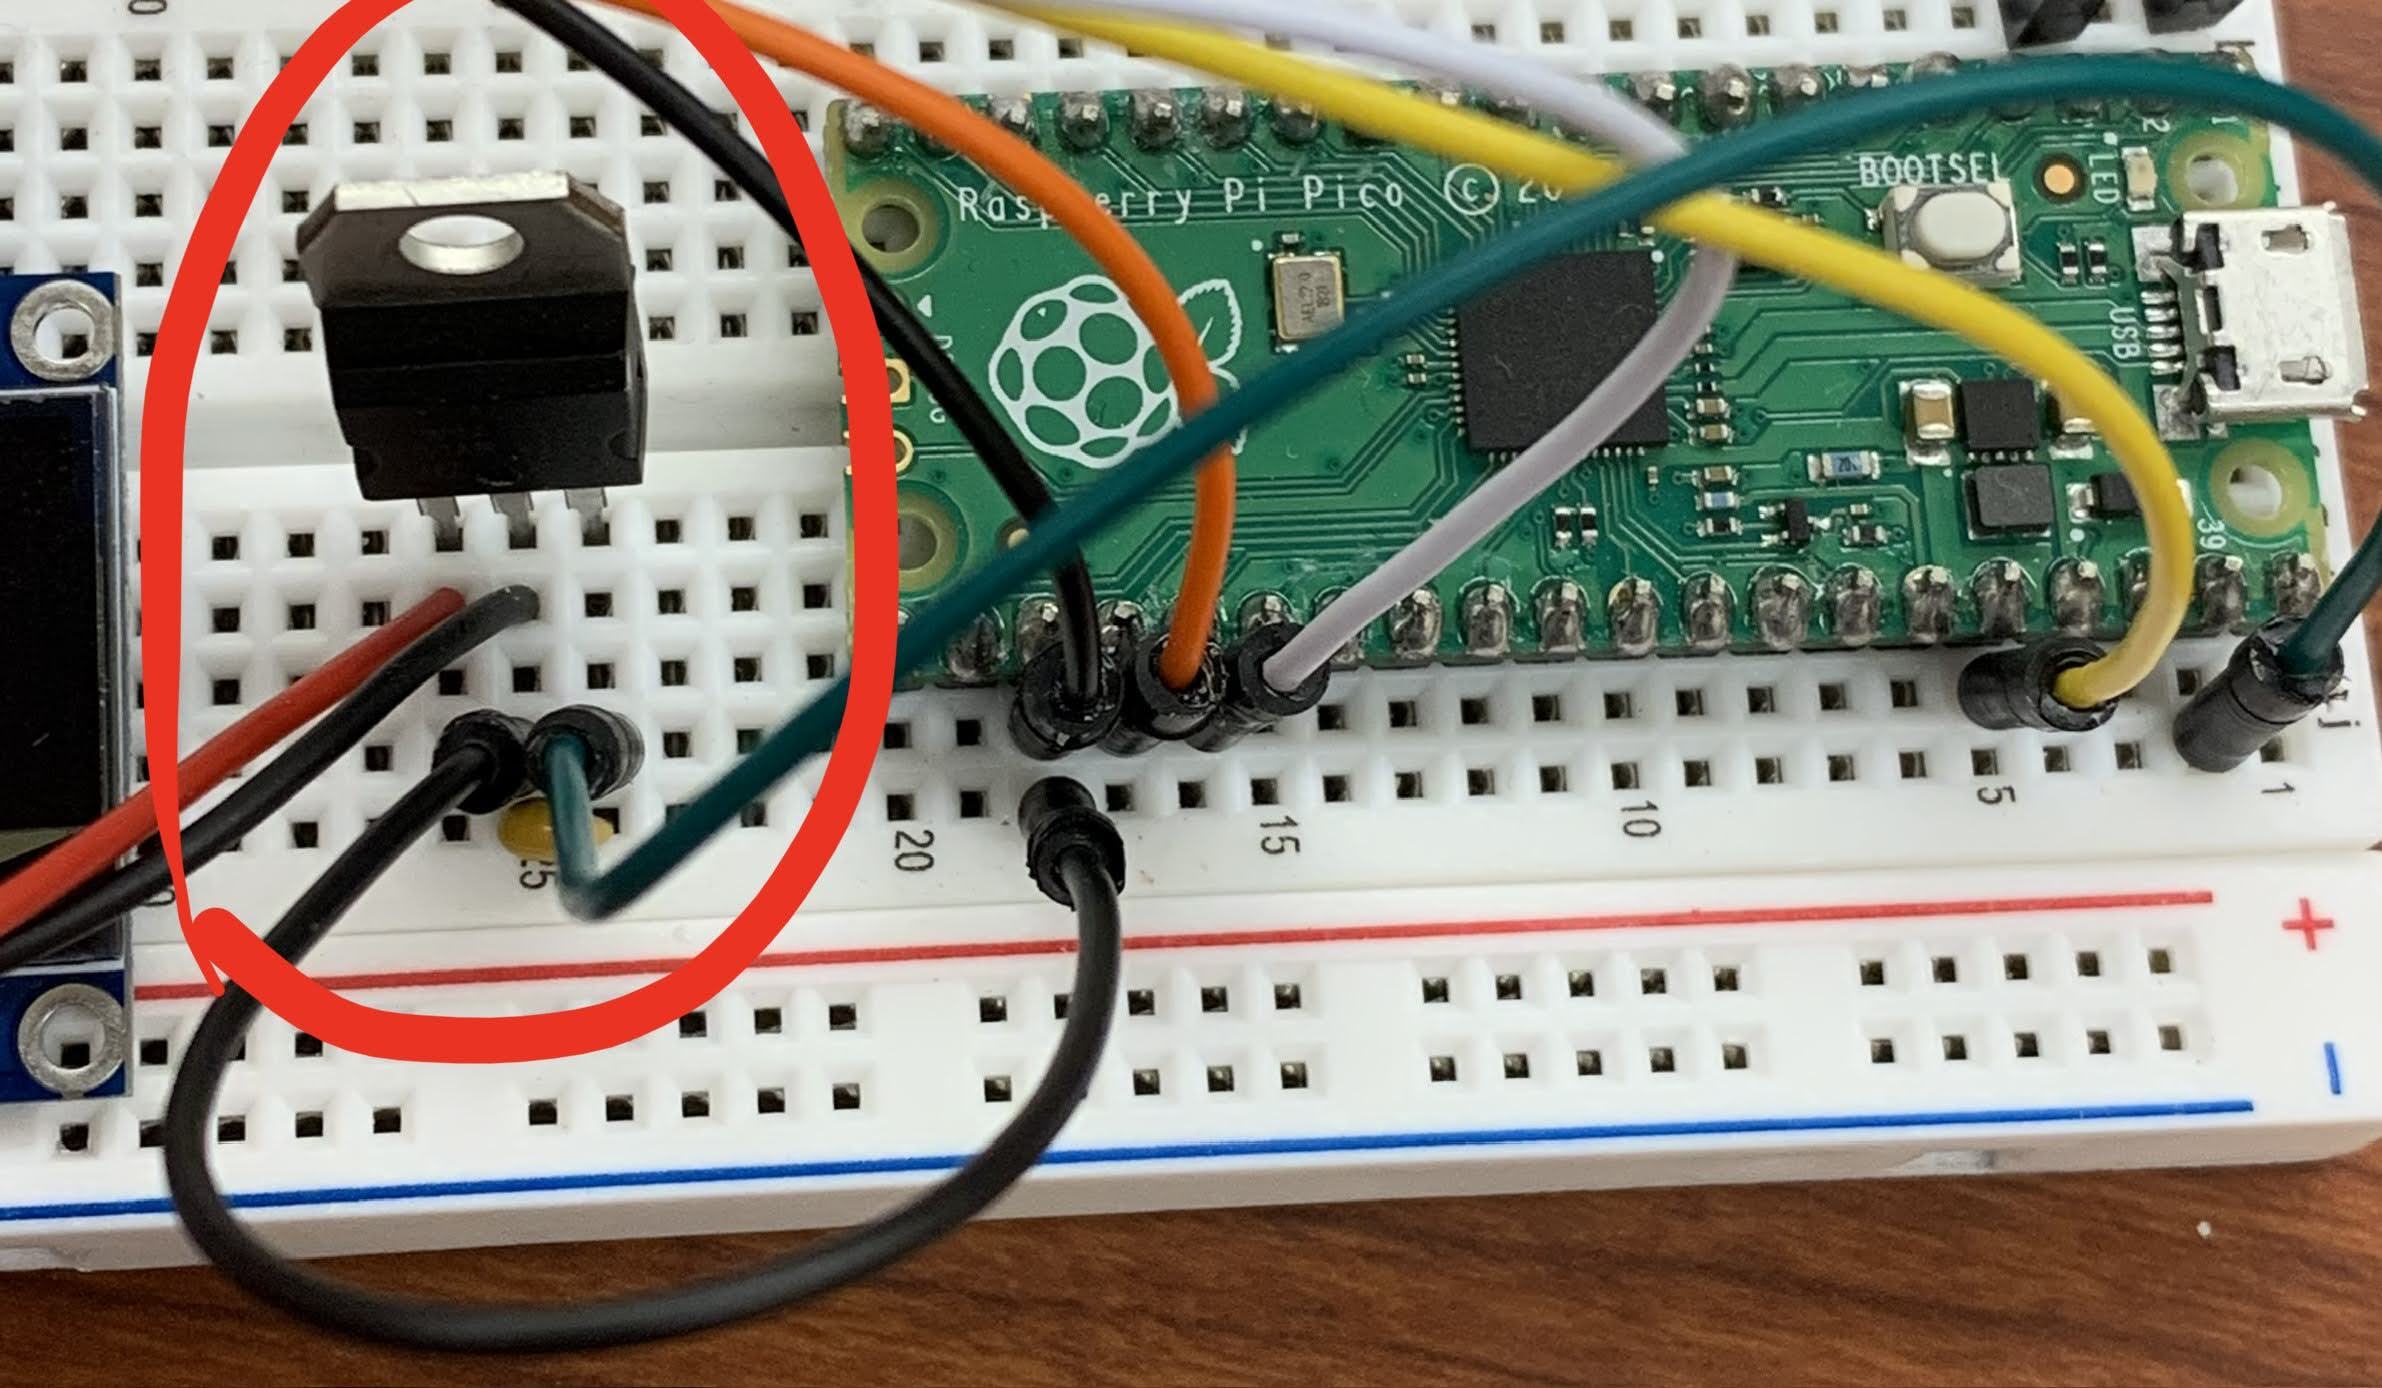
This would not be necessary if we were using a battery with a lower voltage. We are using a 9 volt battery because we already had a bunch of 9 volt batteries. To convert the power coming from the battery to a voltage we can use, we will use one of the most common, cheap voltage regulators available: the 7805. These cost roughly ten cents each when you buy them in large quantities. Using it is very simple:
Battery |
7805 |
Pico |
Capacitor |
|---|---|---|---|
output |
VSYS |
either pin |
|
black (-) |
ground |
GND |
either pin |
red (+) |
input |
The pins on the 7805 are not labeled. You will have to check the data sheet. Do not connect the battery until you have had your circuit checked by an instructor. The correctly wired voltage regulator should look as shown in the image below.
Once you have had your circuit checked, try turning it on. Do not take your circuit apart this time. You will need it next week.